






Stepping on a scale gives you a number. It doesn’t give you a health status.
If you are 6’4″ and weigh 200 pounds, that number likely means you are in a healthy range. If you are 5’9″ and weigh the same 200 pounds, you are likely carrying excess weight. Weight alone is a lie without context. Context is height.
This is why doctors use Body Mass Index (BMI). It is a mathematical formula that combines your height and weight to categorize you as underweight, healthy, or overweight. It is a screening tool, not a diagnosis. It helps clinicians spot potential issues before they become serious conditions.
Here is exactly how the calculation works, what the results mean for your long-term health, and why children require a different metric entirely.
Зміст
How to Calculate Body Mass Index
BMI is straightforward. It accounts for both body weight and height. You can calculate it using the imperial system (pounds and inches) or the metric system (kilograms and meters). The result is a single number that correlates with body fatness.
The formula for those in the United States using inches and pounds is:
(weight in pounds) / (height in inches)^2 * 703
Let’s look at the math. Take a person who is 5 feet 8 inches tall (68 inches) and weighs 180 pounds.
180 / (68^2) * 703 = 27.4
That person has a BMI of 27.4.
For countries using the metric system, the formula is cleaner:
(weight in kilograms) / (height in meters)^2
Using the same physical profile: 99.79 kilograms and 1.905 meters tall.
99.79 / (1.905^2) = 27.5
The slight decimal difference comes from rounding. Both calculations point to the same general category. You can plug your own numbers into any online BMI calculator to find your specific score.
BMI helps health officials understand population trends. On an individual level, it flags weight issues before disease strikes.
Why Your BMI Category Matters
Being overweight or obese is not just an aesthetic concern. It is a physiological risk factor. Studies show a direct link between high BMI and the development of chronic conditions, including:
- Heart disease
- Type 2 diabetes
- Osteoarthritis
- Certain types of cancer
Being underweight carries risks too. Low BMI often signals malnutrition or other underlying health issues that compromise your immune system and bone density.
BMI allows doctors to identify these risks early. If your score is high, it triggers a conversation about diet and exercise. It is a starting point for intervention, not a final verdict.
However, BMI is not the whole story. It does not measure body composition. It cannot distinguish between muscle mass and fat mass. A marathon runner and a sedentary person might have the same BMI but vastly different health profiles. Other factors—diet quality, physical activity levels, and smoking status—play equal roles in determining your actual health.
BMI for Children: A Different Game
You cannot apply adult BMI categories to kids.
Children’s bodies change rapidly. A toddler naturally has higher body fat than a pre-teen. Boys and girls also develop different body compositions as they enter puberty. Using a static adult formula would yield inaccurate results.
To account for age and gender, scientists developed BMI-for-age.
Doctors use growth charts to track children and teens between the ages of two and 20. This metric factors in height, weight, age, and sex. It compares the child’s BMI to a reference population of peers. The result is a percentile ranking.
This percentile predicts future health risks. It indicates whether a child is likely to become overweight as an adult. Parents and pediatricians use these charts to monitor development and make lifestyle adjustments early.
You can access the complete set of CDC growth charts online to see where a child falls on the spectrum.
The number on the scale is just data. The context is everything.
Understanding Percentiles Without the Panic
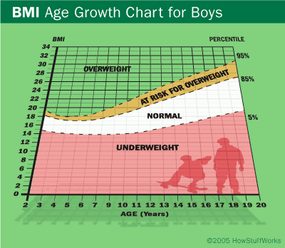
Look at the squiggly lines on those growth charts. They aren’t just decorative. They show percentiles.
Here is the thing most people miss. A 15-year-old boy in the 75th percentile for BMI isn’t overweight. He is at a normal weight. It simply means 75 percent of boys his age have a lower BMI. He is heavier than three out of four of his peers. But that is where the confusion starts.
People see “75” and think “top quartile.” They worry.
The body doesn’t work like a spreadsheet. It grows. Your child’s BMI will change. It is supposed to change. What matters is the trajectory. If he stays around that same curve as he fills out, he is likely fine. He remains in a healthy range.
It’s not about hitting a specific number. It’s about staying in lane.
Why the Curve Matters More Than the Number
You might wonder why doctors care so much about the line instead of the actual weight. The answer is simple. Kids are different sizes. A tall teen will naturally weigh more than a short teen of the same body composition.
The percentile adjusts for age and sex. It levels the playing field.
If your daughter was in the 50th percentile at age 10, and she is still around the 50th percentile at age 16, her growth is consistent. She is growing at a normal rate. Her body is keeping up with itself.
However, if she was in the 90th percentile and dropped to the 10th, that’s a red flag. Or vice versa. The shift is what doctors watch. Not the static number.
How to Read the Chart Without Losing Sleep
You don’t need a degree in pediatrics to get this. Just keep it simple.
- Find the age. Locate your child’s birthday on the horizontal axis.
- Find the weight or BMI. Follow the vertical line up.
- Check the curve. Where does it land? Is it hovering around one band?
If the line is smooth, you’re probably okay. If it’s zigzagging wildly, ask your pediatrician. But don’t fixate on the exact percentile. The 74th and 76th are basically the same in the real world. The gap between them is noise.
When to Actually Care
Most of the time, you don’t need to worry. The human body is resilient. It adapts. But there are moments where the chart tells a different story.
If the line crosses two major percentile lines up or down, that’s worth a conversation. Not because your child is suddenly unhealthy, but because something might need checking. Growth spurts can look like jumps. Illness can look like drops. Context is everything.
The Bottom Line
Your child is not a data point. They are a person.
The chart is a tool. A guide. Not a judgment.
If they are active, eating reasonable foods, sleeping well, and happy, the number on the page is just one piece of the puzzle. A small one.
So let the lines curve. Let the numbers shift. As long as the path is steady, you’re doing fine.
Why the Same BMI Means Different Things for Boys and Girls
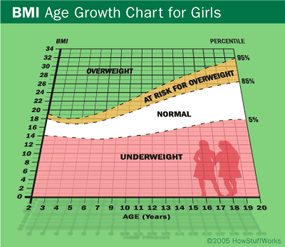
Here’s the thing about teenage bodies: they don’t all change in the same way. The standard “normal” BMI range shifts upward as girls mature. Why? Because teenage girls naturally carry more body fat than teenage boys of the same age.
So you have a scenario where a boy and a girl might share the exact same BMI number. One could be perfectly healthy while the other is flagged for risk. The metric alone doesn’t tell you who is safe and who needs attention. It misses the biological context entirely.
Pediatricians know this. That’s why they don’t obsess over a single snapshot. They look at the trend. Kids hit growth spurts. Their bodies shift. A one-time number is useless if it doesn’t account for that upward trajectory over months or years.
Is BMI Actually Measuring Body Fat?
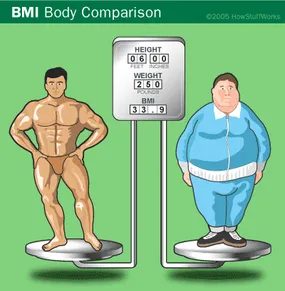
We need to talk about the accuracy of this tool. It works most of the time. But it fails in specific, predictable ways. BMI cannot tell the difference between muscle and fat.
Think about it. Muscle is denser. It weighs more than fat.
Look at professional football players. Many of them are labeled “obese” on paper because their muscle mass drives their BMI sky-high. In reality, they have low body fat. The scale is lying to them. The chart is misclassifying health.
It’s not that the math is wrong. It’s that the math is blind to composition.
Why the Scale Lies for Older Adults
The number on the scale doesn’t tell the whole story, especially as we age. Body Mass Index (BMI) was never designed to be a perfect diagnostic tool, but it becomes particularly unreliable in elderly adults. The math fails because it can’t distinguish between fat and lean tissue. Older bodies often experience significant muscle loss and decreased bone density. You might check your BMI and see a number that falls squarely in the “normal” range, yet your body composition tells a different, more concerning story.
It is entirely possible to be classified as normal weight while carrying excess adipose tissue. This hidden risk is often called “skinny fat.” Without the structural support of muscle, that excess weight puts undue stress on joints and metabolic health. The metric simply doesn’t account for where the weight is held or what it is made of.
Ethnicity also plays a major role in how BMI correlates with health risks. The standard cut-offs were largely derived from data on white populations. For Asian individuals, the threshold for health complications is significantly lower. Research consistently shows that Asians may face increased risks for conditions like type 2 diabetes and cardiovascular disease at a lower BMI compared to Caucasians. Using a one-size-fits-all number ignores these biological realities.
BMI may relate differently to various ethnic groups, with some facing higher health risks at lower numbers.
This isn’t to say BMI is useless. It is a quick, free screening tool. But it should never be the final word on your health. If you are older, or if you belong to a group with different risk profiles, you need more than a calculation based on height and weight. Look at how your clothes fit. Check your blood work. Listen to your body. The number is just a starting point, not the destination.

Relying on Body Mass Index (BMI) as the sole judge of your health is a gamble. It’s a rough tool, prone to error, and should never stand alone. If you are looking at your number and worrying, take a breath. The National Institutes of Health (NIH) suggests doctors look at a bigger picture. They recommend assessing weight status using three specific factors together.
First, you have the BMI itself. Second, you need to look at waist circumference. This isn’t just about clothes fitting; it’s a direct measure of abdominal fat, which carries its own set of health risks. Third, and perhaps most importantly, you must check for existing risk factors. Are you dealing with high blood pressure? High LDL cholesterol? Low HDL? High blood sugar? Do you smoke? These metabolic markers often tell you more about your immediate health than a number on a scale ever could.
Is Body Fat Percentage More Accurate?
Many health experts argue that body fat percentage is a far superior indicator of weight status compared to BMI. Think about it. Two women can have the exact same BMI. One might be an athlete with dense muscle; the other might have low muscle mass and higher fat stores. Their health profiles are completely different, yet the BMI says they are identical.
The problem is practicality. Measuring body fat precisely is not always easy or cheap. You can’t just buy a kit for your bathroom mirror. More accurate tests exist, but they require a trained professional and often a clinical setting.
- Skin-fold measurements: A technician pinches a fold of skin to measure subcutaneous fat. It’s simple but relies heavily on the technician’s skill.
- DEXA scans: Dual energy X-ray absorptiometry measures bone density and body composition with high precision. It’s expensive and involves radiation exposure.
- Bioelectrical impedance: This test sends a weak electric current through your body. Lean tissue conducts electricity well; fat tissue resists it. It’s faster and cheaper than DEXA but can be affected by hydration levels.
For most people, these tests are overkill or inaccessible. That’s why BMI sticks around. It’s free, it’s quick, and it’s standardized. But it’s not the final word.
The History of BMI
Using a formula to calculate obesity isn’t a new idea. It goes back to the 19th century. A Belgian statistician named Adolphe Quetelet developed what was originally called the Quetelet Index of Obesity. He came up with a simple mathematical relationship: weight divided by height squared.
The formula looks like this: w/h²
It was elegant in its simplicity. Before 1980, doctors didn’t use this index. Instead, they relied on weight-for-height tables. There was one table for men and another for women. These tables gave ranges of body weights for each inch of height. The limitation was obvious. They were based on weight alone. They ignored body composition. Muscle weighs more than fat. So a muscular person could be flagged as “overweight” by these old tables, even if they were perfectly healthy.
BMI became the international standard for obesity measurement in the 1980s. It replaced those clunky tables. But it didn’t enter the public consciousness until the late
The Shifting Goalposts of Body Mass Index
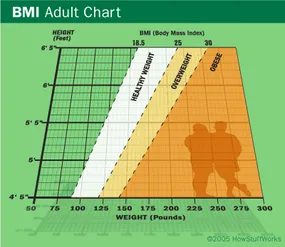
The line between “healthy” and “overweight” isn’t fixed. It moves. In 1998, the National Institutes of Health (NIH) lowered the BMI threshold for overweight status from 27.8 to 25. They did it to align U.S. standards with international guidelines. The result was immediate and massive. Suddenly, 30 million Americans who were previously classified as having a healthy weight were reclassified as overweight.
The metric didn’t change. The definition did.
Today, the NIH doesn’t tell you to look at BMI in isolation. They advise doctors to include it as just one part of a complete assessment of body size and overall health. It’s a tool, not a verdict. But the controversy remains. Why did they change the number? Who does it benefit? And what does it mean for you?
Beyond the Scale
BMI has its critics. It doesn’t account for muscle mass. It doesn’t distinguish between fat and bone density. Yet, it persists. Why? Because it’s simple. It’s cheap. And for large-scale public health tracking, simplicity has value.
If you’re trying to understand your own health metrics, don’t stop at the number on the scale. Look at the whole picture.
- Muscle matters. Athletes often score “overweight” on BMI charts. That doesn’t mean they’re unhealthy.
- Fat distribution counts. Where you carry weight matters more than the total number. Visceral fat poses different risks than subcutaneous fat.
- Context is key. Age, gender, and ethnicity all influence what a “healthy” BMI looks like for a specific person.
The CDC and other health organizations emphasize that BMI is a screening tool. It flags potential problems. It doesn’t diagnose them. You need more data to know if your weight is affecting your health.
Where to Look Next
If you want to dig deeper into how bodies work and how weight is managed, there are reliable sources. The CDC provides detailed BMI-for-age charts for children and adolescents. The NIH’s National Heart, Lung, and Blood Institute offers guidance on maintaining a healthy weight.
For a broader understanding:
- How Fat Cells Work: Understanding the biology of adipose tissue helps explain why weight loss is hard.
- How Dieting Works: Most diets fail because they ignore metabolic adaptation. Learn why.
- Low-Carb vs. Low-Fat: Which approach suits your biology? The answer varies.
- Exercise and Heart Health: Coronary heart disease is linked to many factors beyond weight. Exercise plays a role, but it’s not a magic bullet.
Sites like Sharecare and MedlinePlus offer practical Q&As. They don’t promise quick fixes. They offer evidence-based advice.
The Bottom Line
You can’t change the BMI chart. You can’t change the NIH’s 1998 decision. But you can change how you use the information.
Don’t let a number define your worth. Or your health.
Use BMI as a starting point for a conversation with your doctor. Ask about your body composition. Ask about your blood work. Ask about your lifestyle. Then decide what changes make sense for you. Not for the guidelines. For you.
The conversation about weight is never really over. It just evolves. And so do we.